
Understanding Climate Change in Canada
Canadian Temperature Records Show No Response to CO2
Temperature trends well established prior to 1970 continue to the present day
It is clear that CO2 levels have NO EFFECT on Temperature....

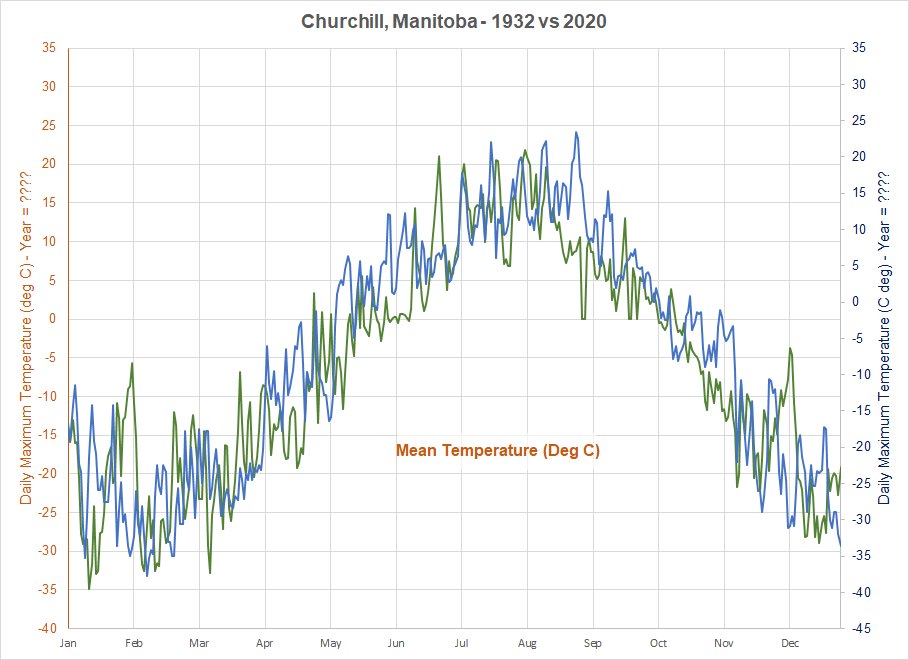
Historical Temperatures for Churchill, Manitoba show a slow but steady temperature increase beginning before CO2 increased and continuing at the same rate up to the present day
Other Canadian Cities show similar historical trends that have no correlation with CO2 Source

North Bay, Ontario temperatures show essentially no change over the past 86 years as CO2 has increased. The record high temperature was set in 1936.

Temperatures in Cold Lake have shown a very slight increase from 1952 onward, but after 1980 the Rate of Change has decreased with less warming being observed.The 2021 "Heat Bubble" failed to exceed the previous record set in 2002. A similar record was set in 1964.

Lytton, BC has shown no change over the past 92 years. A new record was set in 2021, but is clearly an anomaly. A similar "Heat Bubble" occurred in 1941. Note the pattern of high temperatures (> 37C) over the years which has not changed even though CO2 has increased.
It is Important to Recognize the Full Range of Temperature Variation in Canada
Match the Temperature Trend to the Year it occurred ........


What Canadians Have Been Told About Anthropologic Global Warming is a Lie!
Although Temperature appears to correlate with CO2, it does not
- In Period #1, temperature increases at the same rate when CO2 is ~300 - 310 ppm as it does with much higher CO2 in Period #3
- In Period #2, temperature actually decreases while CO2 increases

There is No Statistically Significant Correlation Between CO2 and Temperature
Standard statistical methods clearly demonstrate there is no correlation and therefore no causation.
- To prove causation, there must be a Proportional Change in Temperature for every Change in CO2. This relationship must be consistent across the Full Range of ALL Data Points.
- The Rate of Change (RoC) in Period #1 is almost identical to that in Period #3 even though CO2 is at significantly different levels. This clearly shows that CO2 does not drive Temperature.
- The RoC in Period #2 further demonstrates that there is no Link. Temperature is independent of CO2.
- Therefore, CO2 is NOT the Control Knob for Temperature.

Correlation does not prove causation
- The story is told in the "Residuals"
- When "Residuals" are not equally distributed, it proves there is no correlation

Here is a what a Temperature Profile Would Look Like if CO2 did in Fact Drive Temperature
- The first graph (1 of 2) shows a simulation of actual temperature data from a Canadian Location that has had a Theoretical CO2 effect applied
- Temperature Data prior to 1974 is real data without a CO2 affect applied. Note that it shows a steady decline in temperature
- Data from 1974 onward is the actual temperature to which a simulated CO2 has been added
- Post 1974, a very clear and well defined upward trend can be observed.
But clearly, there is no correlation between increasing CO2 and unmodified measurement data
- In the second graph (2 of 2) the downward trend from 1935 to 1974 continues to the present day
- Note the relatively cooler period that begins in 1980 and continues to 1998. This is why AGW proponents frequently use 1980 as a starting point when they display temperature data. Without seeing earlier data, it falsely suggests that temperatures are increasing

This is a simulation only and does not reflect actual temperature measurements

This is real measurement data showing no correlation with CO2
Climate Alarmists Constantly Modify Temperature Measurements to Hide the Inconvenient Truth
- Early Temperatures are adjusted downward to show cooler periods pre-1980
- High temperatures in the 1920s and 1930s contradict the AGW propaganda that we are now seeing unprecedented high temperatures
- Later Temperatures are adjusted upward to suggest there is more warming than there actually is
- To understand the reasoning behind this charade, just FOLLOW THE MONEY!

Don't be fooled by a chart where the temperature scale is set to show only a few degrees
In Canada, normal temperatures range up to 70 C and a variation of a few degrees is meaningless

Even several degrees of warming will not have a noticeable effect on Canadians
- This example assumes 3 degrees of warming. This is the "existential" threat we have been warned about
- Higher temperatures will only be felt on a few days each year
- Except for a few days at the height of summer, temperatures will not be outside of the normal range
- There would be several positive effects including a slightly longer growing season and possibly reduced heating costs

There is NO Climate Emergency!
CO2 is NOT a control knob to adjust temperature
